Kansas City W vs Orlando Pride W: A Clash of Identities
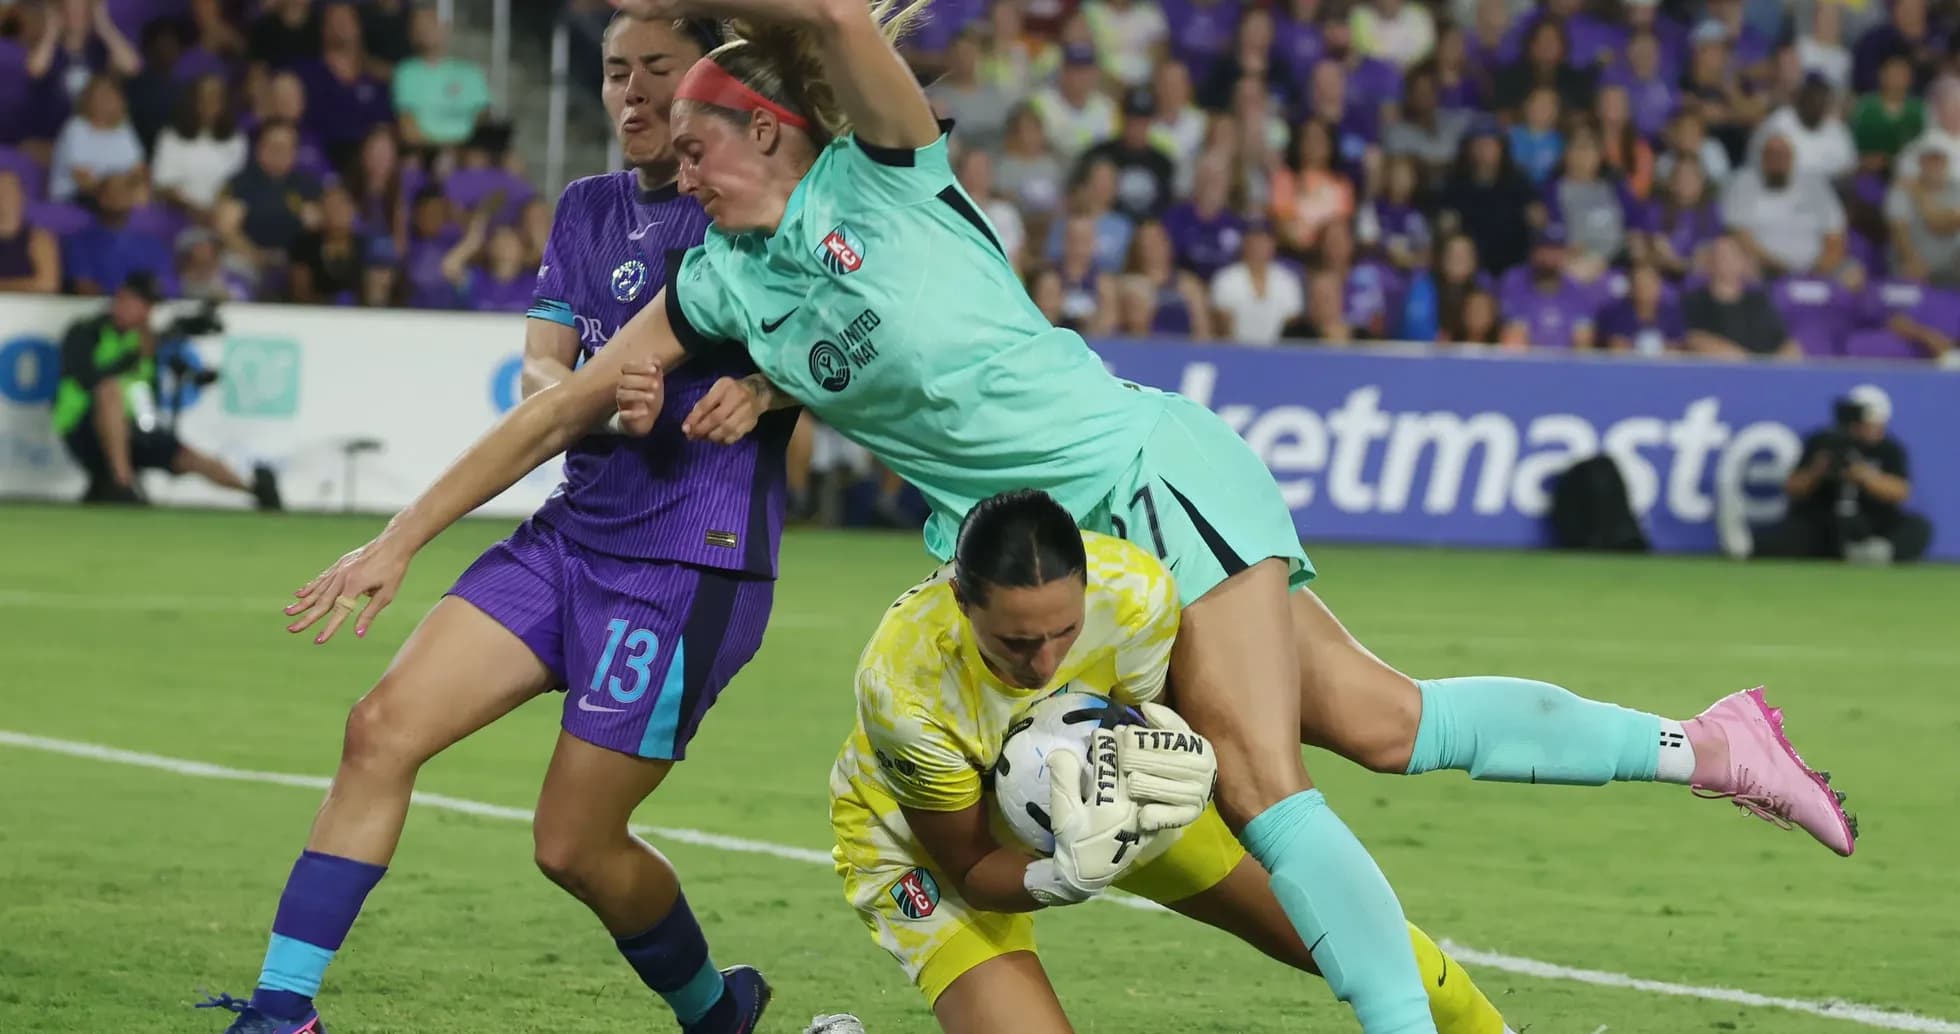
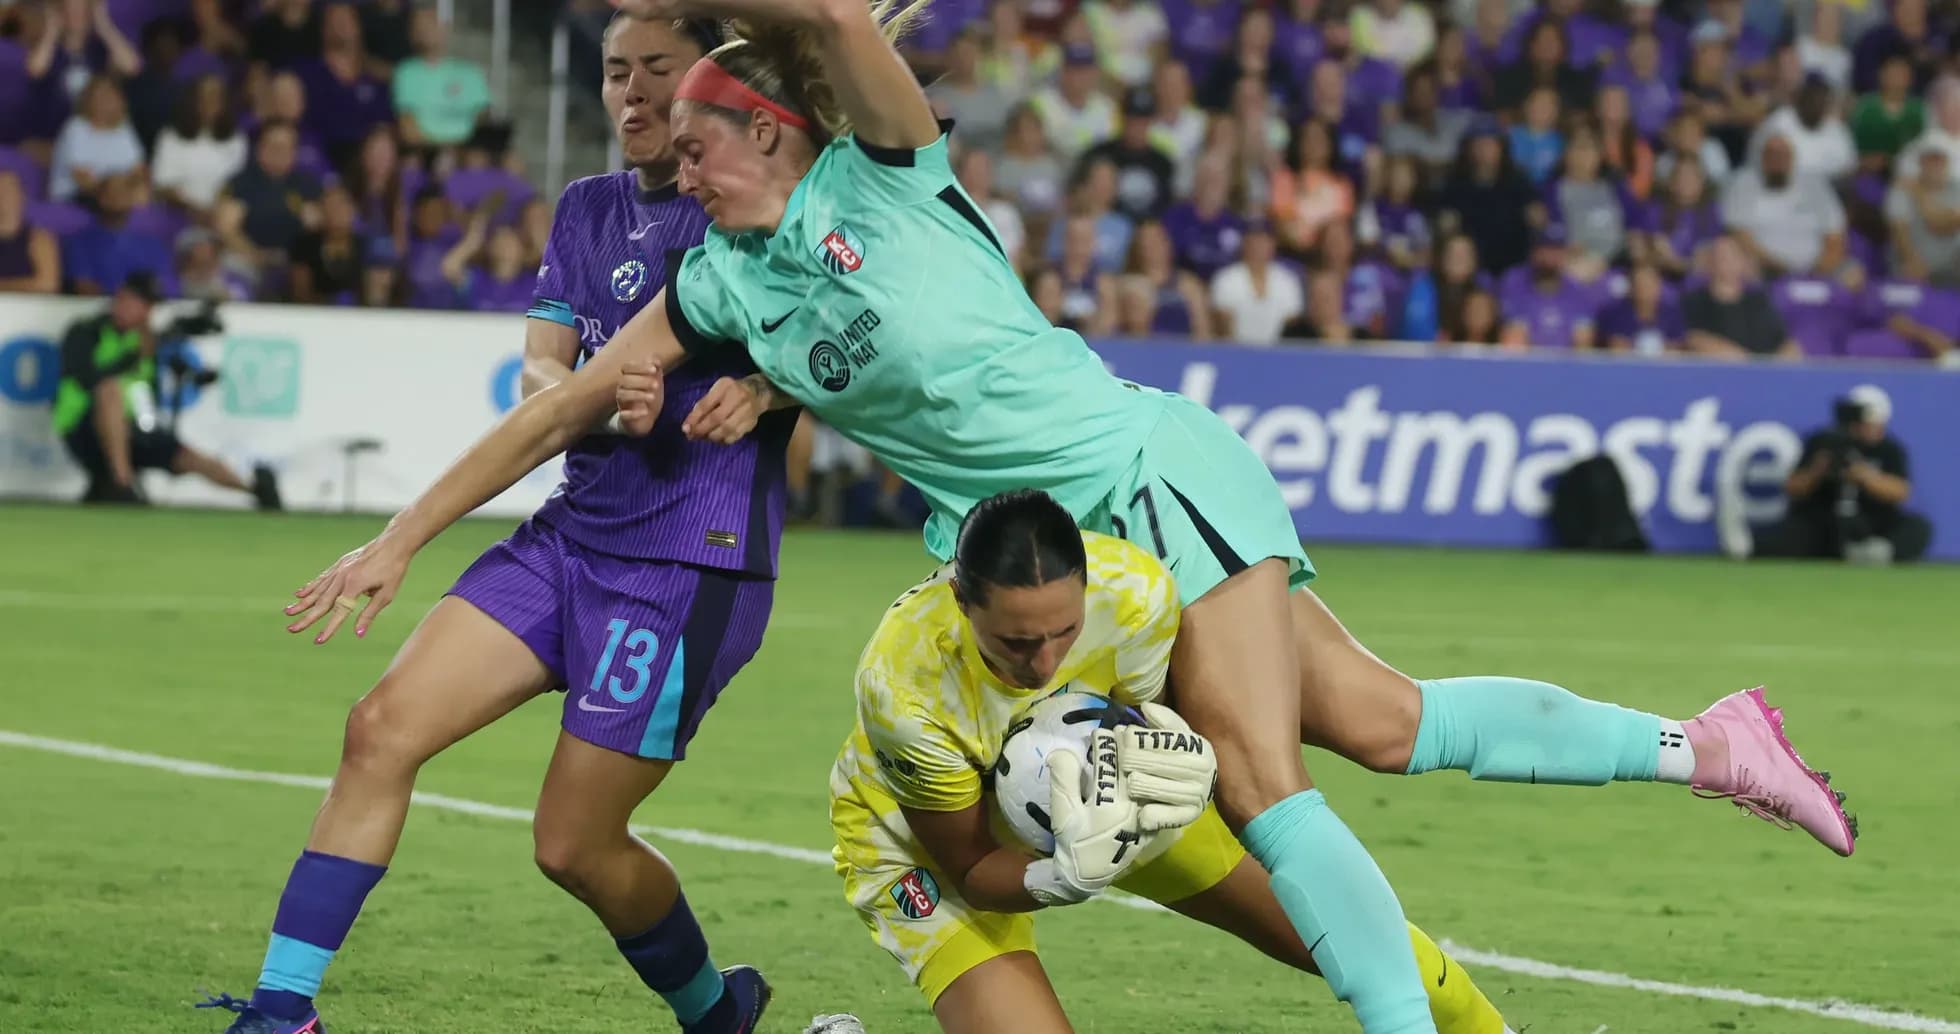
Under the lights at CPKC Stadium, this Group Stage meeting in the NWSL Women felt less like a routine league fixture and more like a collision of identities. Kansas City W, unbeaten at home in the league, stared down an Orlando Pride W side built around one of the competition’s most devastating forwards. The 2–2 final scoreline reflected that tension: a home juggernaut forced to bend, and an away underdog refusing to break.
I. The Big Picture – Two Different Paths to the Same Result
Following this result, Kansas City remain the league’s archetypal home bully. Across the season they have played 24 matches in total, winning 11, drawing 5 and losing 8. The numbers at CPKC are ruthless: 12 home games, 8 wins, 4 draws, 0 defeats. At home they score 28 goals and concede 12, an average of 2.3 goals for and 1.0 against. Overall, their goal difference is +5, with 39 scored and 34 conceded.
Orlando arrive with a more volatile profile. Over 24 matches in total they have 9 wins, 3 draws and 12 defeats, sitting 11th in the table on 30 points with a goal difference of -5 (31 for, 36 against). On their travels they have played 12 times, winning 3, drawing 2 and losing 7, scoring 12 and conceding 20. Away from home they average 1.0 goal scored and 1.7 conceded, a fragile platform that makes a point at this venue feel significant.
Both sides lined up in a mirrored 4‑2‑3‑1, but the systems carried very different intentions. For Kansas City, the shape is familiar and refined: it has been used 18 times this season. For Orlando, it is the base of their campaign too, deployed 15 times, but often adapted to survive rather than dominate.
II. Tactical Voids and Discipline – Where the Edges Fray
There were no listed absences in the data, so both coaches could lean into their strongest structures. For Kansas City, that meant Lorena in goal behind a back four of L. Rouse, E. Ball, K. Sharples and I. Rodriguez. In front, the double pivot of L. LaBonta and V. DiBernardo underpinned an attacking band of M. Cooper, Debinha and T. Chawinga, with H. Hopkins as the lone forward.
Orlando’s answer was symmetry: C. Morché in goal, a back line of Oihane Hernández, C. Dyke, H. Anderson and H. Mace, shielding a double pivot of H. McCutcheon and A. Lemos. Ahead of them, S. Yates, Angelina and L. Ovalle worked behind the spearhead of B. Banda.
Discipline is an undercurrent in both squads. Kansas City’s yellow-card pattern is scattered but spikes late in halves: 25.00% of their yellows arrive between 31–45 minutes and another 25.00% from 76–90. Orlando’s profile is more combustible; 24.14% of their yellows fall between 61–75 minutes and another 24.14% from 76–90, precisely when fatigue and desperation collide. Angelina, a starter here, carries a red card already this season, a reminder that Orlando’s aggression in midfield can tip over.
The penalty record is another quiet vulnerability. Kansas City have been awarded 3 penalties in total but scored only 1, missing 2 for a conversion rate of 33.33%. Orlando have had 4 and converted 2, missing 2 for a 50.00% rate. In a tight knockout-style atmosphere, neither side can claim to be ruthless from the spot.
III. Key Matchups – Hunter vs Shield, Engine Room vs Engine Room
The headline duel was always going to be B. Banda against the Kansas City back line. Banda is the league’s second-ranked attacker by rating, with 14 goals and 1 assist in 20 appearances. Her 56 total shots with 32 on target underscore a volume shooter who can generate danger from half-chances. She thrives in transition and in the channels, testing duels (152 in total, 64 won) and forcing defenders into uncomfortable foot races.
Kansas City’s defensive numbers show why this was a genuine test. Overall they concede 1.4 goals per game, but at home that drops to 1.0. The danger window, though, is clear: 22.86% of their goals conceded arrive between 31–45 minutes, and another 17.14% from 76–90. Orlando’s scoring pattern intersects ominously with that: 26.67% of their goals come in the 31–45 range and another 26.67% from 76–90. The late‑game surge is real, and this match’s script followed that tension—Kansas City trying to close the door just as Orlando’s attack typically hits its stride.
On the other side, the “Hunter” for Kansas City is T. Chawinga, nominally listed as a midfielder but operating like a second striker from the left half-space. She has 10 goals and 2 assists in 13 appearances, with 24 shots and 16 on target, and her dribbling (29 attempts, 13 successful) stretches back lines. Orlando’s away defence concedes 1.7 goals per game, and 24.32% of their goals against come between 46–60 minutes, the exact window where Kansas City are most lethal: 28.95% of their goals are scored in that 46–60 segment. It is no coincidence that the second half at CPKC felt like a storm whenever Chawinga and Debinha received early ball after the restart.
Behind Chawinga, the creative fulcrum is spread across M. Cooper and the absent-from-lineup but season-defining figure of Croix Bethune. Cooper, who did start here, brings 5 goals and 4 assists this season, with 16 key passes and 36 dribble attempts, 14 of them successful. Her ability to arrive late in the box and press high complements Hopkins, who has 5 goals and 3 assists and leads the line with a relentless duel volume (192 total, 85 won). Together, they stress Orlando’s central defenders C. Dyke and H. Anderson, especially in that 46–60 window where Orlando’s structure historically wobbles.
In Orlando’s engine room, Angelina and L. Ovalle are the dual-threat creators. Angelina’s passing accuracy of 78% over 530 passes and her 12 key passes make her the tempo-setter, while Ovalle’s positioning between the lines drags LaBonta and DiBernardo into uncomfortable zones. Yet Angelina’s disciplinary record—a red card and 2 yellows—means that when Kansas City accelerate transitions through Debinha and Cooper, she is always one mistimed challenge away from tilting the balance.
IV. Statistical Prognosis – A Draw That Explains the Table
Following this result, the numbers still lean toward Kansas City as the more sustainable side. Overall they average 1.6 goals scored and 1.4 conceded per game; Orlando sit at 1.3 for and 1.5 against. At home, Kansas City’s 2.3 goals per game against Orlando’s away average of 1.0 suggested a home win, but Orlando’s late-scoring profile and Banda’s individual quality always made a draw plausible.
In a match without explicit xG data, the structural indicators tell the story. Kansas City’s dominance at home, their 4‑2‑3‑1 familiarity, and their 46–60 scoring surge collided with Orlando’s away frailty and second-half defensive lapses. Yet Orlando’s 7 clean sheets in total, their capacity to ride out pressure, and Banda’s elite shot volume gave them a puncher’s chance.
A 2–2 finish feels like the statistical midpoint between Kansas City’s home supremacy and Orlando’s chaotic, high-variance identity. For the playoffs, it paints a clear picture: Kansas City remain a terrifying draw at CPKC Stadium, powered by Chawinga, Cooper and Hopkins, but their vulnerability around the ends of halves must be tightened. Orlando, meanwhile, can travel anywhere with Banda and believe—if they can keep their discipline and survive that 46–60 storm, they have the weapons to turn any match into a shootout.